Categories
Uncategorized

Avoiding Common Mistakes And Build a Future-Proof Energy Management Ecosystem

Companies often understand the importance of deploying smart meters and getting data online. They see it as a key milestone—and while it is, it’s only the beginning of the journey. As mathematicians say, this is a “necessary condition” but not a “sufficient condition.” Without proper utilization, the full potential of your smart metering investment remains untapped. Let’s explore some common misconceptions and mistakes made in this space.

Mistake #1: Focusing on Visual Style and “Gadgets”

Making energy data accessible on a tablet, phone, or PC is useful—but that alone doesn’t mean you’re leveraging it effectively.  Too often, decision-makers focus on the appearance of dashboards and the appeal of new gadgets, prioritizing style over substance. While good design can enhance usability, it’s one of the least important factors in an effective energy management system. The real value isn’t in how the data looks, but in how it’s processed and analyzed to extract actionable insights that drive real impact.

Mistake #2: Lack of Computational Capabilities

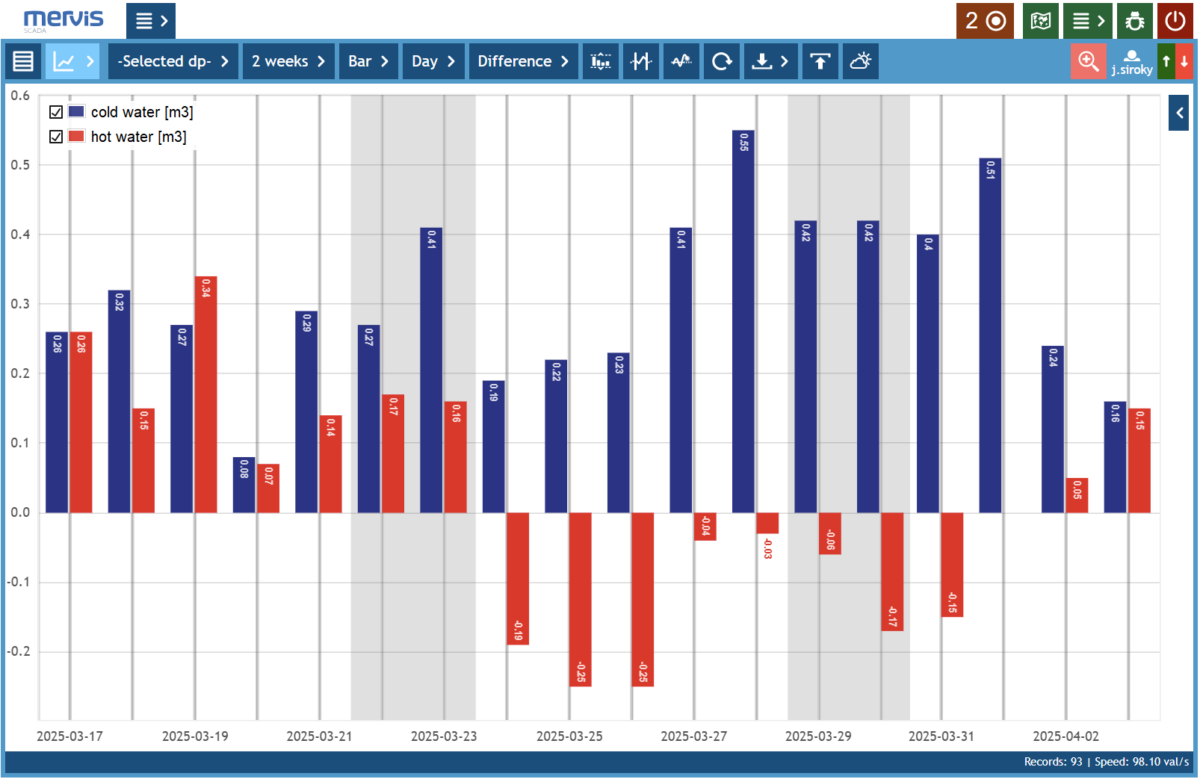
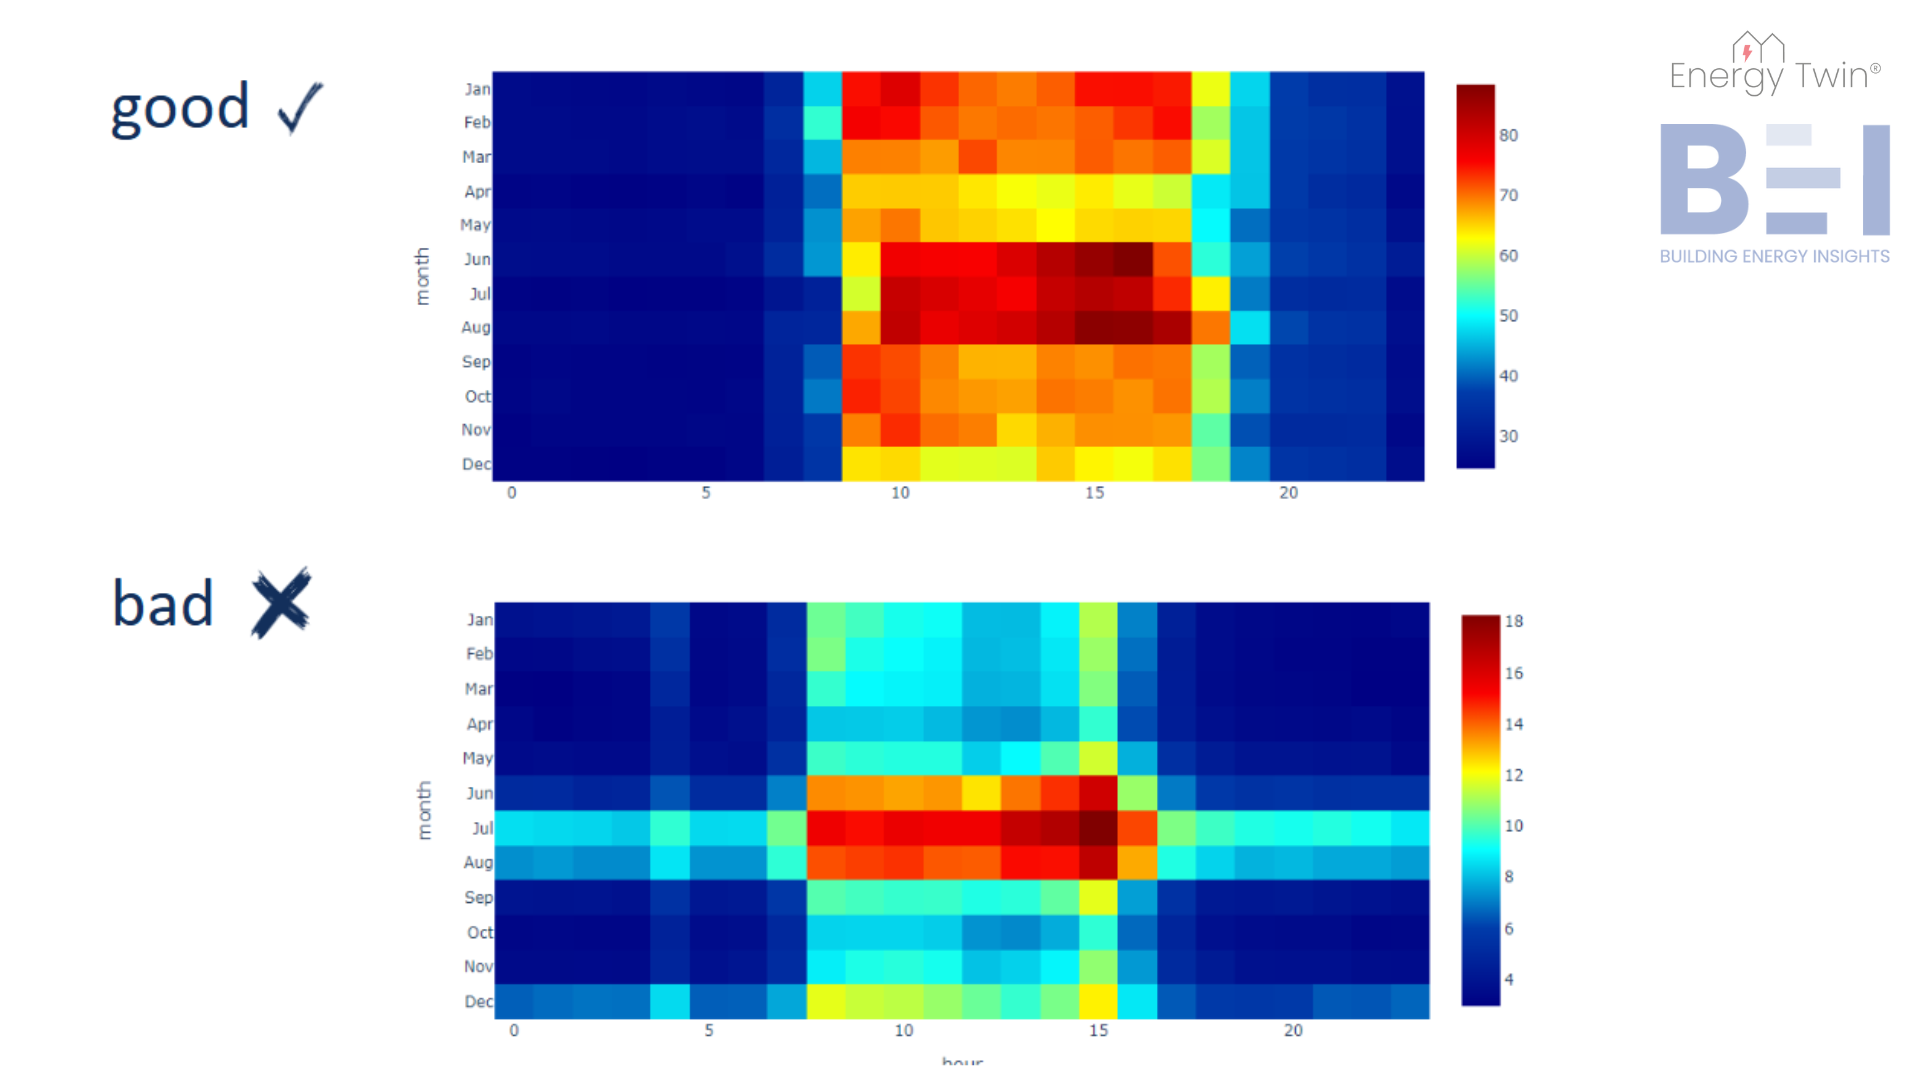
Many energy software tools offer basic charting features, allowing users to compare energy consumption across time periods, like months or years. Some even incorporate weather normalization through degree days. While these functions are useful, they fall short when dealing with smart meter data, which often comes in 15-minute intervals. This level of granularity introduces a new challenge—one that requires more advanced computational methods than simple charts or weather adjustments can offer.

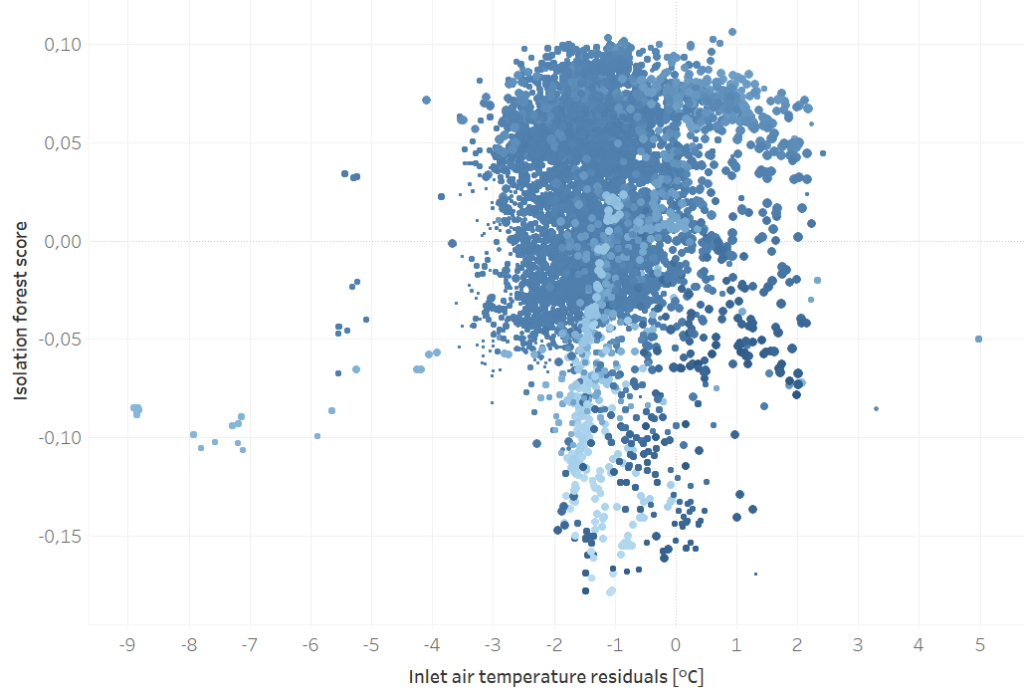
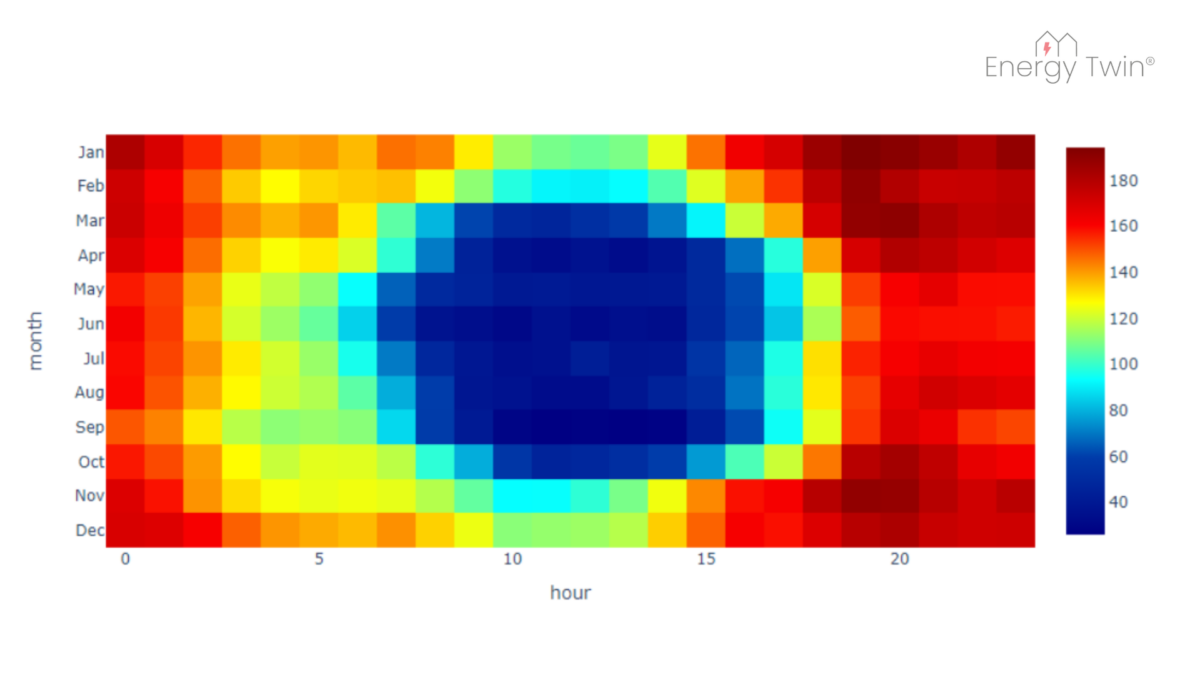
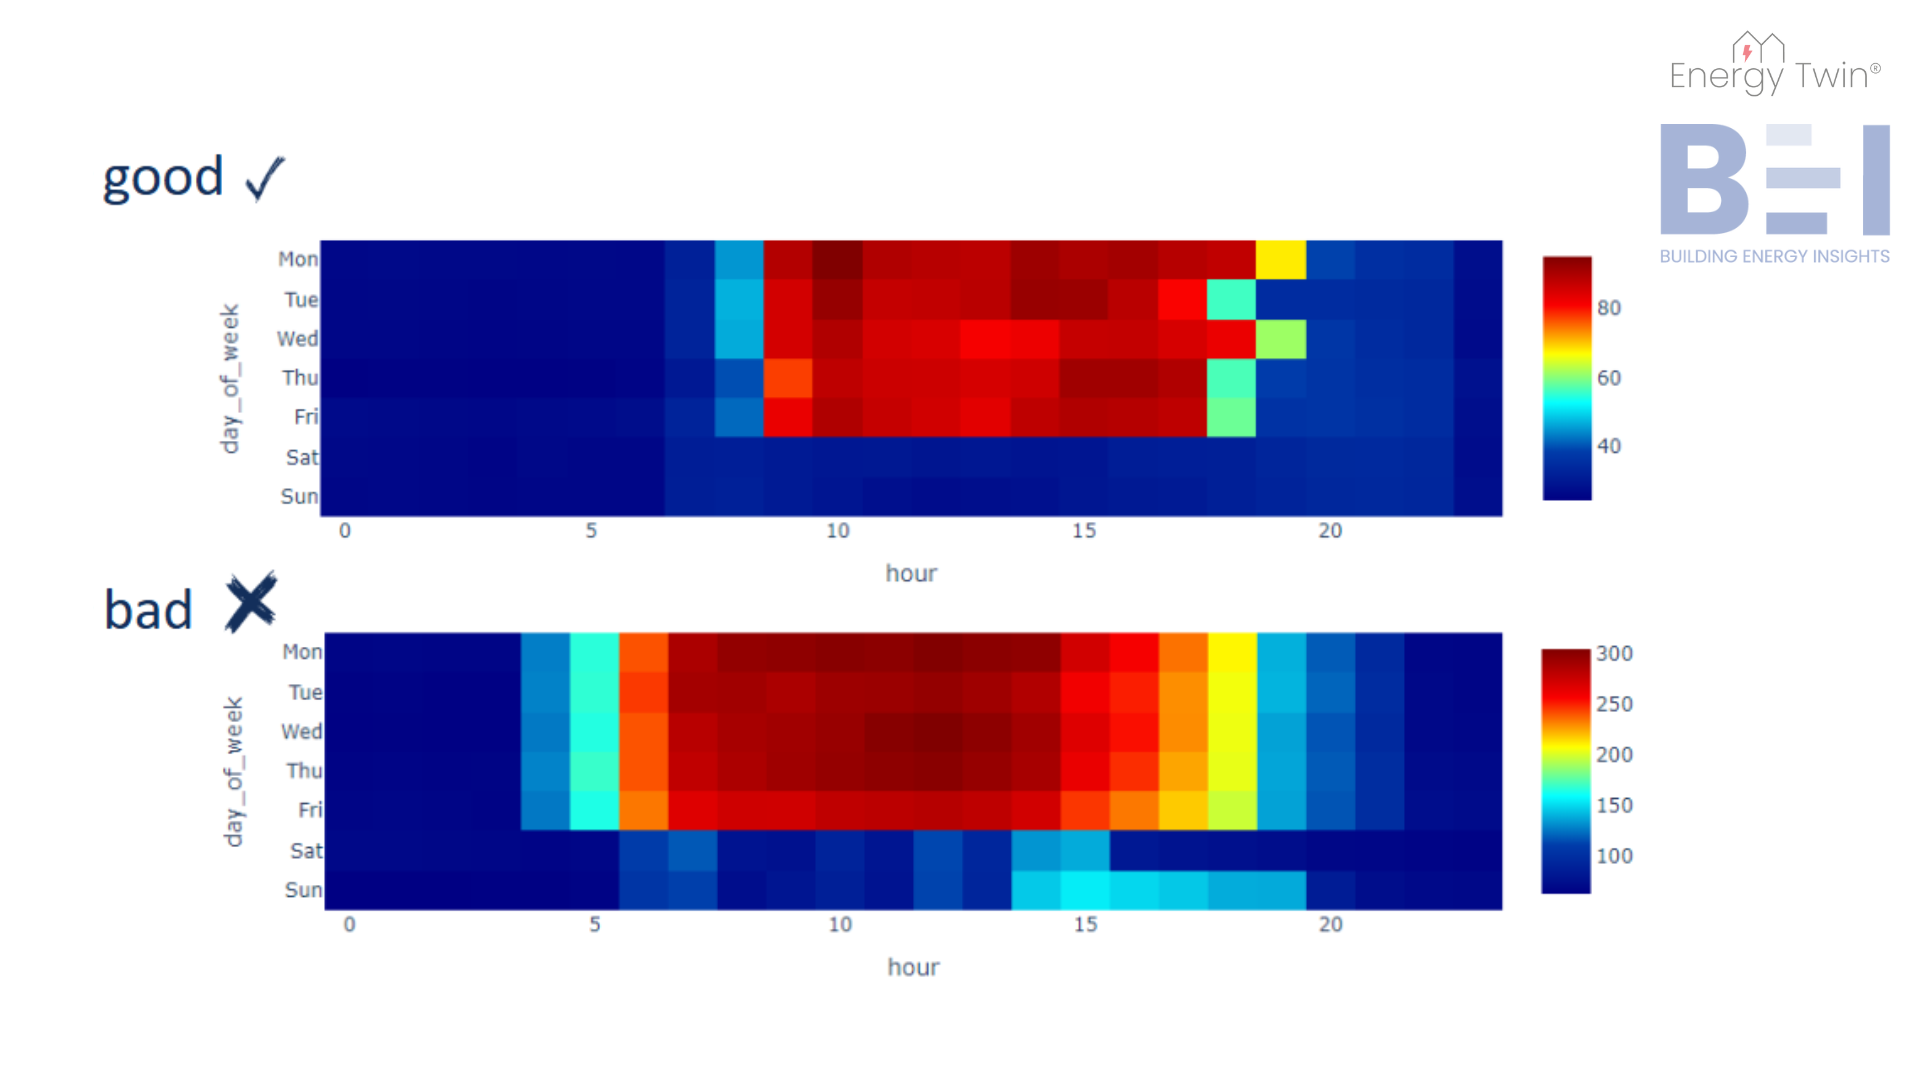
Most software platforms aren’t built to harness the full power of these high-frequency data streams. Advanced machine learning (ML) algorithms can uncover hidden patterns, enabling businesses to improve efficiency and optimize performance. Without these computational tools, companies miss out on valuable insights, ultimately leaving much of their smart metering investment underutilized.

Mistake #3: Expecting One Tool to Solve Everything

In many Requests for Proposals (RFPs), companies look for an all-in-one solution—software that can handle everything from data collection and compliance reporting to invoicing, tariff calculations, forecasting, and AI-driven analytics. Ideally, they want a system that does it all with a single click while adhering to local regulations.

However, expecting one tool to excel in all these areas is unrealistic, especially given the diverse and region-specific requirements in the energy sector. Instead, companies should prioritize creating an independent data layer—a centralized repository where energy data is accessible via APIs. This approach allows for modularity, enabling you to integrate and replace specialized tools as needed without vendor lock-in. With this setup, each component of the ecosystem performs at its best while remaining seamlessly connected to the larger system.

Conclusion

Building an effective energy management system isn’t just about installing smart meters or selecting a single software solution—it’s about creating a foundation that is both flexible and future-proof. The key lies in establishing an independent data layer, a centralized hub where energy data remains accessible via APIs. This ensures seamless integration across different tools and systems, giving businesses the freedom to adapt and experiment without being tied to a single vendor.


By adopting this modular strategy, you can harness the full potential of your energy data. Advanced AI-driven tools can uncover hidden insights, optimize operations, and identify opportunities that might otherwise go unnoticed. At the same time, maintaining an independent data infrastructure allows for smooth integration of key processes like regulatory compliance, ESG reporting, and tariff calculations, all without the constraints of an all-in-one platform.


In the rapidly evolving energy landscape, flexibility is essential. By building an energy management ecosystem that encourages experimentation and innovation, you position yourself to continually improve and adapt. The journey doesn’t end with data collection—it begins there. A well-structured, independent data layer ensures that the insights gained today will continue to drive smarter decisions for years to come.

Categories
Uncategorized

Why Basic Anomaly Detection Fails in Energy Data (And How ML Fixes It) ⚡

Detecting anomalies in energy data is key to optimizing consumption, reducing costs, and ensuring building systems run efficiently. With the vast amount of data from smart meters, manual oversight isn’t practical—this is where machine learning (ML) steps in! 


The basic idea is simple: train an ML model to predict energy consumption based on historical data and use this model to compare predicted and measured values. Any significant deviation between the two can signal an anomaly. But how do we define and detect these deviations? There are several approaches, ranging from basic thresholding to advanced statistical and algorithmic methods, which we will explore in this article.

Basic Anomaly Detection Algorithms

Absolute Value Deviation – The simplest approach is setting a fixed absolute threshold. If the difference between measured and predicted energy consumption surpasses a set threshold, it is identified as an anomaly. While straightforward, this approach doesn’t scale well across different buildings, for instance, a threshold that works well for a large office building may lead to false positive or missed anomalies in a small retail store.

📊 Relative Value Deviation – A more adaptable method considers deviations as a percentage of the predicted value, e.g., more than 50% deviation triggers an alert. This works well across varying energy scales but can cause false positives for buildings with low consumption.

🔗 Combined Approach – The best of both worlds! By applying both absolute and relative thresholds, anomalies are flagged only when both criteria are met (e.g., >20% deviation and >5 kW). Adding a minimum duration filter helps avoid false alarms from short-lived fluctuations.

An example of relative value deviation rule with a 50% threshold.
Advanced Anomaly Detection Algorithms

The above-mentioned basic algorithms can be simple and effective, they may struggle with complex patterns and time-dependent variations in energy data. Let’s have a look at more advanced anomaly detection algorithms that enhance accuracy and reliability.


🔢 Statistical Tests – Statistical methods offer a more sophisticated approach. For example, energy consumption profiles for weekends can be compared to typical weekday profiles. If weekend energy usage closely resembles a workday pattern, it may indicate that HVAC systems are not being properly adjusted for setbacks.

📈 Integral-Based Comparison – This method integrates the differences between predicted and measured values over time. By accumulating small deviations, it detects anomalies when the cumulative difference crosses a predefined threshold. This approach is particularly effective for identifying subtle but persistent changes that might be missed by simpler methods.

Quantifying Temporal Dissimilarity – Advanced techniques like the CORT dissimilarity index go beyond magnitude comparisons, capturing temporal misalignments between predicted and measured values. For instance, if energy consumption lags or leads expected trends, CORT can highlight these discrepancies. Compared to basic thresholding, such methods provide deeper insights into the nature of anomalies, particularly in time-dependent patterns.

An example of daily integral rule.
Practical Considerations for Anomaly Detection

So far, we’ve covered both fundamental and advanced techniques for detecting anomalies in energy data. But theory alone isn’t enough—real-world implementation comes with its own set of challenges. In this article, we’ll focus on two key aspects: handling holidays and effectively representing anomalies.


🎄 Handling Holidays – Holidays present unique challenges for anomaly detection since they disrupt regular energy consumption patterns. Inaccurate modeling of holidays can lead to missed anomalies or false positives. At Energy Twin we address this issue by treating holidays as an “eighth day of the week” – separate from Saturdays or Sundays with distinct modeling properties. Holidays can be downloaded automatically based on location or manually defined, ensuring accurate anomaly detection even during non-standard periods. Automatically downloading holidays simplifies working with international portfolios, ensuring consistency across different regions.

📊Representing Anomalies – When managing large building portfolios, anomaly detection can generate hundreds of alerts. Without effective representation, prioritizing and acting on these anomalies becomes overwhelming. Energy Twin models integrate seamlessly with existing solutions such as SkySpark’s Swivel feature, providing intuitive, portfolio-wide overviews. Instead of sifting through endless alerts, building managers can pinpoint key anomalies in minutes, ensuring efficient monitoring and decision-making across their entire portfolio.

An example of detected Czech public holiday - 28th October.
Conclusion

Anomaly detection is a cornerstone of energy efficiency, enabling proactive management and substantial cost savings. Machine learning enhances this process, providing precise and reliable models that minimize false alarms—often the biggest challenge in deploying such systems.


At Energy Twin, finely tuned ML models and robust integrations with tools like SkySpark empower us to monitor hundreds of buildings in mere minutes. This ensures no significant issue in energy consumption goes undetected, delivering actionable insights that translate into real-world benefits. With ML-driven anomaly detection, energy efficiency is not just a goal but an achievable reality – turn anomaly detection into strategic advantage! 🚀

Categories
Uncategorized

4 “Reasons” Why Not to Use AI in Energy Sector (And Why They Don’t Hold Up)❌

AI has become a buzzword in the energy sector, promising efficiency, cost savings, and data-driven decision-making. Many see its potential and are intrigued by what it could do for their operations. Yet, when it’s time to take the leap, hesitation sets in. Concerns arise, often disguised as logical reasons to delay adoption. But are these genuine obstacles or just common misconceptions?


Let’s take a closer look at the four most common concerns about AI in energy management—and how they can be addressed

Reason #1: “We Don’t Have People to Operate AI Tools”

AI tools often come with the perception that only the most skilled technicians can operate them effectively. Since these experts are already managing critical tasks, organizations hesitate, worrying that adopting AI will stretch their team even thinner. The concern isn’t just about learning new tools—it’s about balancing priorities without disrupting daily operations.


Solution: Adopting AI doesn’t have to add to your team’s workload. Many AI providers offer more than just software—they provide support, data handling, and actionable insights, so your organization can benefit without needing in-house expertise from day one. Over time, your team can gradually build familiarity with the tools if needed, but AI can start delivering value right away without straining your workforce.


Reason #2: “Adding AI Feels Like One More Problem to Solve”

Maintenance teams are already operating at capacity, juggling countless requests and addressing urgent issues as they arise. The idea of implementing AI can feel overwhelming—like adding even more problems to their workload. To them, more data often translates to more tasks, further complicating an already demanding routine.


Solution: Rather than adding to the workload, AI helps teams focus on what truly matters. By prioritizing issues based on real impact—whether energy savings, cost reduction, or operational efficiency—AI cuts through the noise. It removes the human bias that often influences decision-making, ensuring that attention goes to the most critical problems, not just the loudest requests. This allows teams to work more efficiently, saving both time and resources.

Reason #3: “Our Building Is Unique”

Despite numerous studies  showing the potential energy savings from data analysis and energy management systems (EMIS), many customers remain skeptical. They acknowledge that energy efficiency works in theory but struggle to see how AI-powered analytics apply to their specific facility. Traditional upgrades like insulation are easily understood as physical improvements while AI-driven insights may seem abstract. This skepticism keeps many from exploring AI’s real potential in their operations.


Solution: Building performance naturally declines over time—no system is immune. AI tools help efficiently identify and address issues that might otherwise go unnoticed. While not every issue can be solved, addressing the right ones leads to measurable improvements. The proven savings seen in studies and other buildings aren’t just theoretical—they’re just as likely to apply to yours.


Reason #4: “We Just Don’t Have the Budget”

Many organizations hesitate because budgets are tied to existing services, making it unclear who should fund new innovations. Delaying AI adoption could mean missing out on significant financial and operational benefits.

Solution: The ROI from AI-powered energy management is so compelling that it turns budget concerns into opportunities. Many AI tools pay for themselves in less than two years—sometimes in just months—delivering not only cost savings but also long-term operational and efficiency benefits. The financial gains come from identifying inefficiencies, optimizing energy use, and preventing waste—all of which drive significant cost savings.

Moreover, the benefits go beyond short-term savings. AI tools enable organizations to future-proof their operations, support ESG commitments, and establish a foundation for continuous improvement. Allocating a budget for AI isn’t just about funding a project—it’s about investing in a long-term strategy for smarter energy management and sustained efficiency.


Conclusion

Excuses are easy to find, and most organizations struggle with more than one—often all of them. Resistance to change is natural, but history has shown that those who hesitate to adapt risk being left behind. Industries across the board illustrate this reality: Kodak’s reluctance to embrace digital photography led to its downfall, Nokia’s failure to innovate cost it dominance in mobile phones, and traditional taxi companies lost ground to ride-sharing platforms like Uber and Lyft. The lesson is clear—ignoring innovation often leads to irrelevance. 


In today’s fast-evolving landscape, AI in energy management isn’t just an option; it’s a competitive advantage. Organizations that embrace AI unlock efficiency, savings, and long-term sustainability. The real question isn’t whether you can afford to adopt AI—it’s whether you can afford not to.

Categories
Uncategorized

Why Do We Love Banks?🏛️

It’s safe to say we’re not exactly huge fans of banks… as customers. Thankfully, digitalization has rescued most of us from the tedious in-person trips to the branch.Yet, for anyone who prefers the human touch, banks have ensured their branches remain open and accessible. And while standing in line at these branches might not spark joy, there’s something we do love about them: helping optimize their energy consumption.

Why Are Banks Perfect for AI-Driven Energy Optimization?

Over the years, we at Energy Twin have worked extensively with bank branches, and they present some unique characteristics when it comes to energy consumption. Why focus on banks, you ask? It all comes down to one key factor: predictability.


Unlike restaurants or cinemas, where energy use fluctuates between a full house and an empty one, banks are less affected by foot traffic. Whether there’s a queue of five or no customers at all, energy consumption remains consistent. Similarly, banks aren’t influenced by external events like stadiums, amusement parks, or concert venues, where energy usage can skyrocket during peak times.


What makes banks particularly interesting is their operating schedule. With clear opening hours, it’s possible to implement energy-saving setbacks during nights and weekends. With around 120 hours each week when branches are closed, there’s significant potential for cost savings through AI-driven solutions and insights from smart meter data.


Managing dozens or even hundreds of branches gives banks a unique advantage when it comes to energy efficiency. This portfolio scale enables centralized teams to implement impactful, long-term strategies. As organizations committed to environmental, social, and governance (ESG) principles, banks are also under pressure to ensure their energy use aligns with their public sustainability commitments.

Anomaly detection in building portfolio.
Banks Have Their Own Specifics

Optimizing energy in banks isn’t without its quirks. For instance, popular metrics like kWh/m²/year often fall short. Here’s why:

  • Unique Locations: Branches in shopping malls or historical buildings typically use more energy than standalone or modern ones.
  • Size Does Matter: Smaller branches often look less efficient, with worse kWh/m²/year numbers compared to mid-sized locations.
  • Special Cases: Buildings like IT hubs, headquarters, or archive rooms have energy profiles that don’t fit standard benchmarks. And sometimes, you’ll come across a branch with a truly strange energy pattern—only to learn its purpose is classified.

Rather than relying on oversimplified metrics like kWh/m²/year or weather normalization with degree days, we’ve developed machine learning-driven KPIs specifically for banks. These tools help us uncover actionable insights where traditional metrics fall short.

Example of machine learning driven KPIs in a portfolio.
What Have We Found?

Our investigations have uncovered countless inefficiencies, but certain issues crop up time and again. Here are some of the most common culprits:

  • Local heaters: Despite often being prohibited, portable heaters are often found in branches, sometimes left running during nights or weekends, leading to obvious unnecessary energy waste.
  • HVAC schedules: HVAC systems are frequently misaligned with branch operating hours, resulting in off-hours consumption that could easily be avoided.
  • Cooling setbacks: Many systems fail to implement cooling reductions over weekends, continuing to operate even when no one is around.
  • Heating setbacks: Similarly, heating systems are often left running without proper off-hour adjustments, wasting energy when branches are unoccupied.
  • Lighting inefficiencies: Excessive lighting is commonly left on at night, far exceeding what’s necessary for security purposes.

Beyond these recurring problems, we’ve encountered unique challenges, such as oversized uninterruptible power supplies (UPS) left behind after IT relocations, consuming energy 24/7 without serving their intended purpose. 

Our AI-driven tools are specifically designed to handle these complexities. By leveraging advanced metrics and tailored KPIs, we go beyond surface-level observations to uncover deeper, hidden problems. This allows us to provide precise, actionable insights that enable banks to achieve significant and lasting energy savings across their networks.

Example of bad cooling setback.
Conclusion

While this discussion has focused on banks, the principles we’ve outlined extend seamlessly to similar institutions—post offices, insurance companies, travel agencies, and others with stable schedules and multiple locations. These organizations share a common advantage: optimizing energy consumption can be straightforward when leveraging interval data from main smart meters. With advanced AI algorithms, inefficiencies can be pinpointed and addressed without the need for additional infrastructure or disruptive changes.


Our years of experience with banks have demonstrated that effective energy optimization isn’t about sweeping transformations—it’s about precision. By leveraging data that is already being collected, we uncover hidden savings and deliver measurable results quickly. This approach integrates smoothly into existing operations, scales effortlessly to large portfolios or smaller branches, and makes even the smallest locations worthwhile targets for energy efficiency improvements. Centralized management and predictable schedules further enhance the ability to target even the smallest branches—where traditional energy-saving measures might struggle to show significant ROI. 


Best of all, getting started is simple: interval data from main smart meters is all you need. With AI-driven analysis, energy optimization becomes easy, scalable, and impactful.

Categories
Uncategorized

From Heatmaps to AI 📊: The First Step in Understanding Your Data

Every journey into AI begins with a crucial first step: understanding your data. Many clients approach us eager to jump straight into machine learning (ML), but without a clear grasp of their data or meeting key prerequisites for ML, this leap often leads to frustration. Why? ML can only produce meaningful results when built on a solid foundation—with data preprocessing playing a vital role.


This is where data visualization comes in. Seeing your data clearly and gaining new perspectives and insights is the essential first step. Some methods, like heatmaps, go even further—empowering technical teams with detailed analysis while providing non-technical stakeholders with an intuitive, quick and easy-to-understand view of optimization opportunities.

Heatmaps

For those unfamiliar with heatmaps, they are visual representations of data where values are displayed as colors. This makes it easy to spot patterns, trends, and anomalies at a glance, providing an intuitive way to understand complex information. Let’s explore some examples!

In the following set of heatmaps, the x-axis represents the hour of the day, and the y-axis displays the days of the week. Each cell within the heatmap reflects the average energy consumption for a specific hour and day, providing a concise visual summary of the building’s energy use. This approach is comparable to a pivot table with conditional formatting, where data is organized systematically and shaded to highlight key patterns and anomalies.

The first heatmap showcases an office building with a well-configured weekend setback. The heatmap clearly shows low energy consumption during night hours and weekends, which are shaded in blue. This indicates that the building’s energy use is well-managed during non-operating hours, with peak energy usage occurring during standard working hours, from 9 a.m. to 5 p.m. on weekdays, with slight extensions to 6 p.m. on Mondays and Wednesdays.


In contrast, the second heatmap highlights an office building with operational inefficiencies. Starting with the weekend setback, we see that Saturday is well-managed, but Sunday shows an anomaly. From 2 p.m. to 7 p.m., energy consumption unexpectedly rises, disrupting the consistent blue pattern of low energy use throughout the day. Additionally, there’s a problem with the startup and shutdown periods. If the building operates from 7 a.m. to 5 p.m., why is it starting up as early as 4 or 5 a.m.? The night setback, which is set to begin at 8 p.m., is also somewhat late. It would be more efficient if the setback were activated earlier, around 6 or 7 p.m., to minimize unnecessary energy consumption.

Image 1: Daily heatmap examples.

To gain a deeper understanding of your building’s energy usage patterns, it’s crucial to look beyond daily patterns and consider how energy usage changes throughout the year. In this set of heatmaps, the y-axis represents the months of the year, giving us a clear view of how energy consumption fluctuates across the seasons. 


In the first heatmap, we observe consistent and effective night setbacks year-round. We also see that the building is cooling-dominated, as the highest energy consumption occurs during the summer months of June, July, and August. Some heating-related energy use is apparent in the mornings during January and February. These patterns are typical for an office building in Central Europe, where gas heating is common, and cooling accounts for the majority of electrical energy consumption in warmer months.


In contrast, the second heatmap illustrates inefficient cooling practices. During the summer months, particularly in July and August, night setbacks show higher energy consumption than expected, indicating inefficiency. Additionally, we notice regular energy usage at 4 a.m. in certain months, including June, July, August, and December, which suggests unnecessary operational activity during off-hours.

Image 2: Monthly heatmap examples.

A unique energy pattern is shown in the following heatmap from a building located in Central Europe. The lowest energy consumption occurs during the summer and daylight hours. What’s responsible for this change?


The building is equipped with photovoltaic (PV) panels. This example illustrates how renewable energy sources can significantly alter a building’s energy profile, and heatmaps provide an intuitive way to track and understand these shifts.

Image 3: Energy profile after adding PV panels.
Conclusion

Heatmaps are a powerful yet simple tool for understanding energy consumption patterns. Whether revealing operational inefficiencies in weekly heatmaps or uncovering seasonal trends in yearly heatmaps, they provide a clear, actionable view of a building’s energy usage. By starting with this foundational step, we ensure that the data is not only understood but also prepared for deeper analysis, such as machine learning. This approach enables smarter decision-making and paves the way for AI-driven insights that can optimize energy management across buildings and portfolios.

Categories
Demo Series

Demo Series Part 01 – Energy Twin Interactive

New video series is here! In this video we will show you the full demo of Energy Twin Interactive, our machine learning extension for SkySpark for daily, weekly and monthly data.

Categories
Analytics Walkthrough

ET Analytics Walkthrough 03 Utilizing a model for anomaly detection – Part 1

In this tutorial we will showcase how Energy Twin Analytics models can be used for anomaly detection using pre-defined rules, such as Relative Value Deviation rule.

Categories
Analytics Walkthrough

ET Analytics Walkthrough 02 Visualize a Model Using ET Views

This tutorial is focused on visualization of a model in the app ET Views once it has been identified.

Categories
Analytics Walkthrough

ET Analytics Walkthrough 01 Create a Model

This video demonstrates how to identify a model in the ET Admin app using Energy Twin Analytics.

Categories
Uncategorized

Detecting anomalies in KFC restaurants’ refrigeration equipment❄️

In the fast-paced environment of fast food restaurants, maintaining the right temperature in freezers and coolers is critical. Any deviation from the optimal temperature range can lead to food spoilage, financial losses, and health risks. However, recurring issues with refrigeration equipment—such as frequent door openings, equipment shutdowns, or mechanical failures—pose significant challenges.

Understanding the Challenges: Introduction to Refrigeration Anomaly Detection

To proactively detect and address these issues, ACTuate Facility Technologies, a company specializing in facility energy and system performance optimization for small to midsize buildings optimization, approached us for our data analytics expertise. Through our collaboration, we’re leveraging their extensive dataset from various fast food restaurants to develop sophisticated methods for detecting unusual behavior in refrigeration equipment, such as walk-in and reach-in freezers and coolers.

One of the major challenges in monitoring these systems is the variability in temperature that can occur during normal operations. For example, opening a freezer’s door for a few moments can cause a brief spike in temperature, which typically doesn’t indicate a problem. Regular defrost cycles can have a similar impact to the normal variability of the temperature data. However, more sustained deviations or unusual patterns might signal an issue that requires attention.


To address this, we need a system that can differentiate between normal fluctuations and potential problems—without the need for significant hardware additions. This is where data modeling and mathematical optimization come into play, allowing us to work effectively with the existing sensors and equipment.

Showcasing Temperature Monitoring Through Data Modeling

Based on discussions with the ACTuate team, we identified occurrences of malfunctions and selected a suitable model structure to analyze the temperature data from freezers and coolers. By fitting this model to the data, we can detect unusual system behavior. The process is entirely data-driven.


Our optimization techniques involve using a fluctuating window of past data, which dynamically adjusts in length based on the fit quality. The accuracy of this fit is measured by performance metrics, including Mean Absolute Error (MAE) as can be seen in the picture below. 


Image 1 : Multiple fits with fluctuating window adjusted based on fit quality.

Transforming Data Modeling into Anomaly Detection Rule 

One of the most compelling aspects of our collaboration with the ACTuate team is the development of an active detection rule based on data modeling. This approach not only allows us to analyze past temperature data but also transforms that analysis into a proactive monitoring system. 


Image 2: Resulting anomaly detection rule based on data modeling.

Real-Time Monitoring

With real-time data, you can also use the data modeling to predict if certain thresholds will be breached and communicate with the on-site team about the necessary actions. Sometimes it can be as simple as a reminder to “close the door.” 

Image 3: Real-time monitoring with threshold breach detection.

Conclusion

Through our collaboration with ACTuate Facility Technologies, we have developed a sophisticated approach to monitoring and detecting unusual behavior in refrigeration systems. While our efforts contribute to significant energy savings, the primary objective is to reduce the number of incidents where temperature deviations lead to costly spoilage, ultimately ensuring the safety and quality of the stored product.