



When Targets Meet Reality: What Good and Undesired Behaviour Really Looks Like

Machine learning can be used not only to define realistic energy targets, but also to estimate the impact of specific improvement measures. By adjusting selected ET model parameters, it becomes possible to quantify improvement potential based on real building behavior rather than generic benchmarks.

Power of Portfolio Analysis

When we compare real buildings within the same portfolio, clear patterns begin to emerge. Some sites show unnecessary overnight variability, high weekend base load, excessive cooling response during mild weather, or poor startup and shutdown behavior. Others operate in a much more stable and disciplined way. These small differences are rarely visible in annual kWh/m² figures, but they become immediately clear in detailed ML models.


Below are some of the issues that appear most often across the portfolio.


Unoccupied Hours Setback

In buildings with a regular operating schedule, we expect consumption during nights and weekends to remain stable, without unnecessary spikes, and to stay proportional to the profile during occupied hours.

In a portfolio, the strongest performers provide a practical reference point. That makes target-setting much more credible: if similar buildings from the same portfolio already achieve this pattern, it is hard to argue that it is not feasible for the rest.


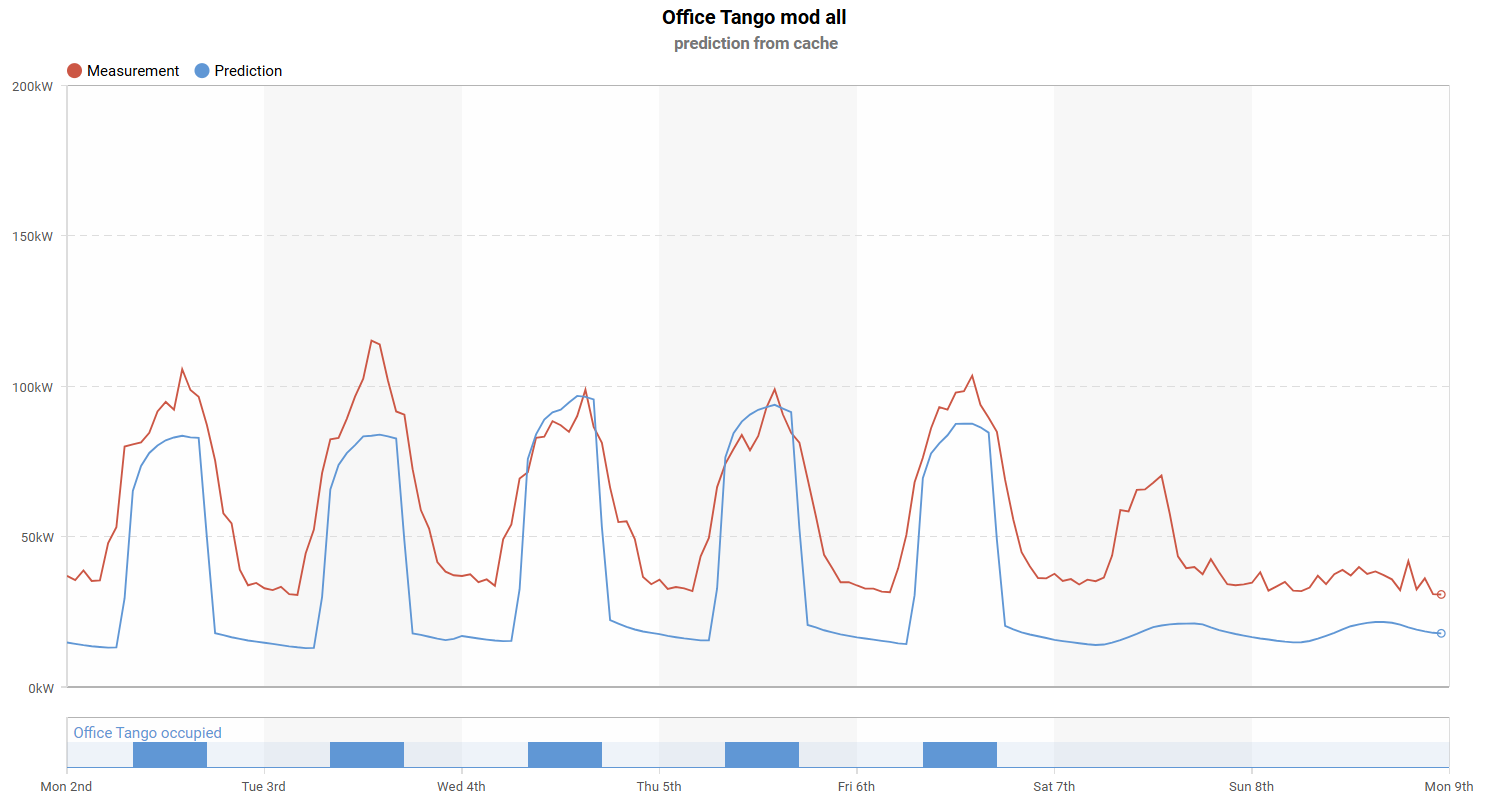
With the modified ET model, we can simulate an ideal setback profile, estimate the potential savings, and determine which buildings in the portfolio should be prioritized. This is clearly illustrated in the chart below: the red line represents the actual measured consumption, while the blue line shows the predicted optimal energy profile.


It is also worth noting that the setback is not represented as a simple flat line with a fixed target value. Its variation reflects weather dependency, which makes the target more realistic and better aligned with actual operating conditions.


Startup Shutdown Optimization

Another common issue appears during startup and shutdown periods. Some buildings begin operating unnecessarily early, creating an opportunity for startup savings. The same applies at the end of the day, when systems often continue running long after the building is no longer occupied.


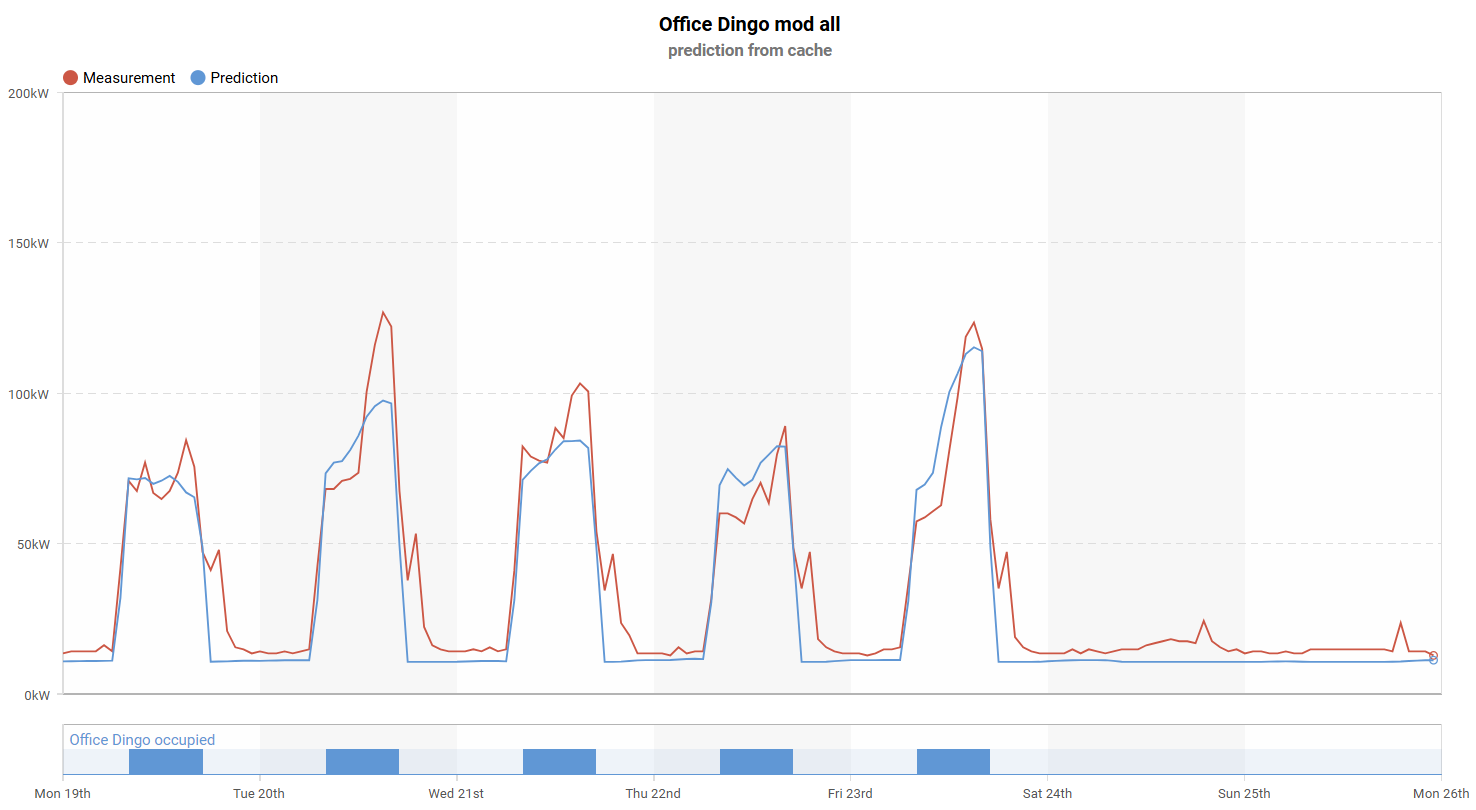
Let’s start with the unoptimized shutdown period. In the chart below, the building does not return to setback consumption until around 10 p.m., even though operations end at 6 p.m. The ideal profile is shown by the blue line, which represents the modified ET model prediction. If technicians can optimize operation during this four-hour period, the resulting savings can be significant.


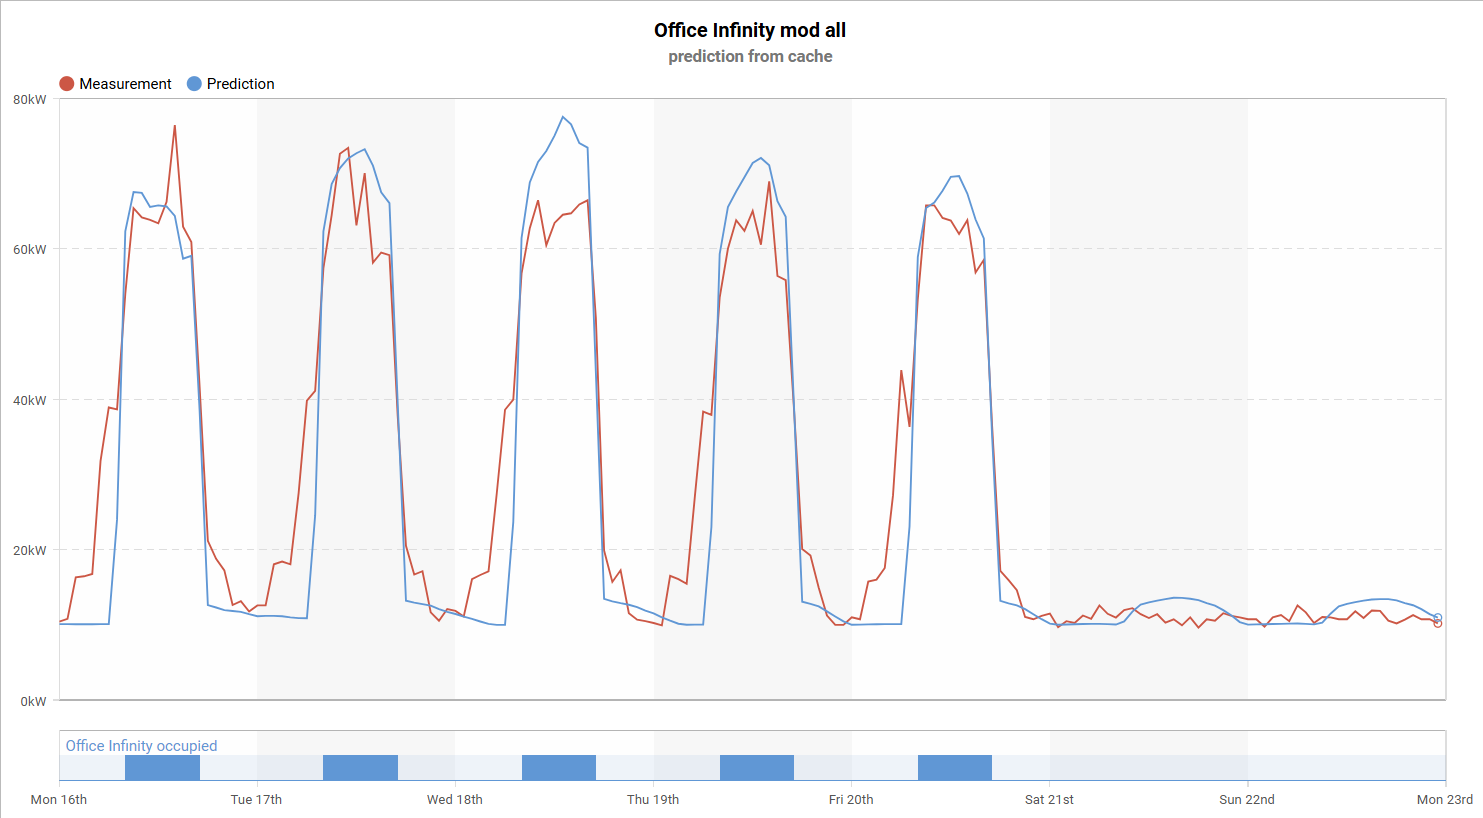
The same principle can be applied to unoptimized startup periods. In this case, the shutdown is relatively well managed, but the issue appears in the morning startup. As the chart below shows, the first increase above setback consumption begins as early as 2 a.m., followed by a second ramp-up around 4 a.m. Once again, the blue line represents the modified ET model, while the red line shows the actual measured data. The gap between the two lines in the morning forms a triangle-shaped area that represents potential energy savings.


Best Performer in the Portfolio

After looking at several examples of undesired behavior across the portfolio, an obvious question follows: is it actually possible for one building to get all of this right? Or are these targets merely theoretical assumptions that are difficult to achieve in practice?


The answer is clear: they are realistic. As noted at the beginning of this edition, targets can be based on the best-performing buildings in the portfolio. In other words, the benchmark is not hypothetical, it is already being achieved in real operation.


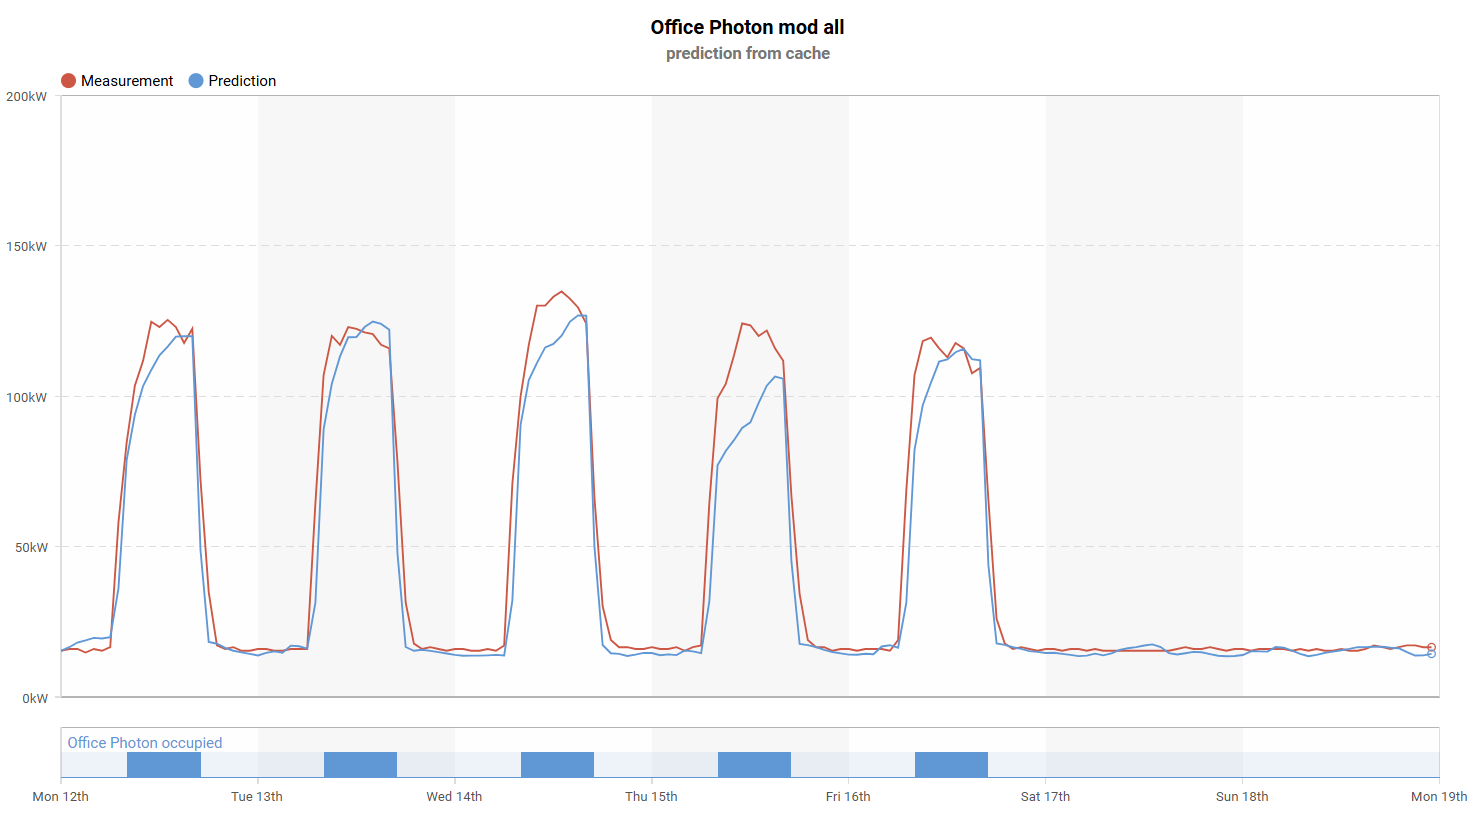
The chart above highlights one such example. This building performs strongly across all of the key areas. Its setback consumption remains stable during unoccupied hours, while both startup and shutdown periods are well aligned and efficiently controlled.


Some buildings operate close to this target with only minimal intervention. Others show improvement potential concentrated in specific operational windows. Once these patterns become visible, the discussion shifts from assumptions to evidence. That is where portfolio-based machine learning becomes truly practical – helping teams identify actionable improvements based on observed building behavior rather than generalized expectations.

Author

Share This Post

More To Explore

Uncategorized

Model Modifications In Energy Data Analysis

What does ideal energy consumption look like for a building? Many facility teams start with general benchmarks – typical kWh/m² per year for a given