Month: March 2025


At Energy Twin, we’ve been working on a research project exploring how machine learning can be used for general fault detection. Like any good research, we aimed high, took an ambitious approach… and didn’t quite get the success we hoped for. But that’s part of the process! Instead of sweeping it under the rug, we want to share our journey—what we tried, what didn’t work, and what we learned along the way.
General Idea
This project focuses on fault detection in air handling units (AHUs), with the broader goal of developing a machine learning-based tool capable of identifying anomalous behavior. In machine learning (ML) terms, this means detecting instances where actual measurements deviate significantly from model expectations.
Our key ambition was to create a generalized approach—minimizing human effort and ensuring that the method is not limited to AHUs but can be applied to virtually any HVAC equipment.
To achieve this, we followed two core principles:
- Independent modeling for each variable – Instead of building a single model for the entire system, we created a separate machine learning model for each measured variable, treating it as an individual prediction target.
- Fully automated model configuration – Both feature selection (i.e., determining model inputs) and model structure selection are automated, removing the need for manual tuning.
One of the biggest challenges in fault detection and diagnostics tools is the prevalence of false alarms. To address this, we designed our system to trigger alerts only when the machine learning model is operating within a known data range. In other words, we only flag deviations when similar conditions have been observed during the model’s identification period. If the model encounters previously unseen conditions, we discard the deviation, as we lack a reliable reference for expected behavior.
Diving into ML Details
Now, let’s take a closer look at the implementation. For model identification, we leveraged our Python-based Energy Twin tools, which already provide a strong foundation for fully automated modeling and fault detection. What made this project particularly ambitious was that everything—feature selection, model structure optimization, and anomaly detection—was handled without any human intervention. Once the process started, the only limiting factor was raw computational power.
The key components of our approach included:
- Automated feature selection – Using SHAP values and permutation importance, our system independently identified the most relevant inputs (independent variables) for each model.
- AutoML-driven model selection – The optimal model structure and hyperparameters were determined automatically, ensuring peak performance without manual fine-tuning (using AutoML principles).
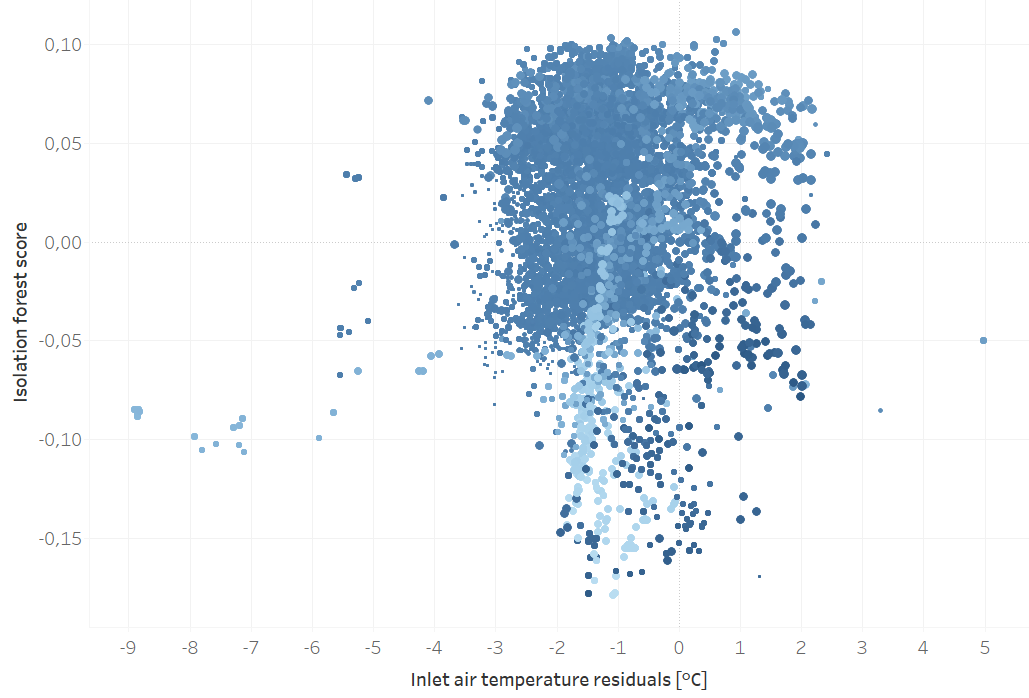
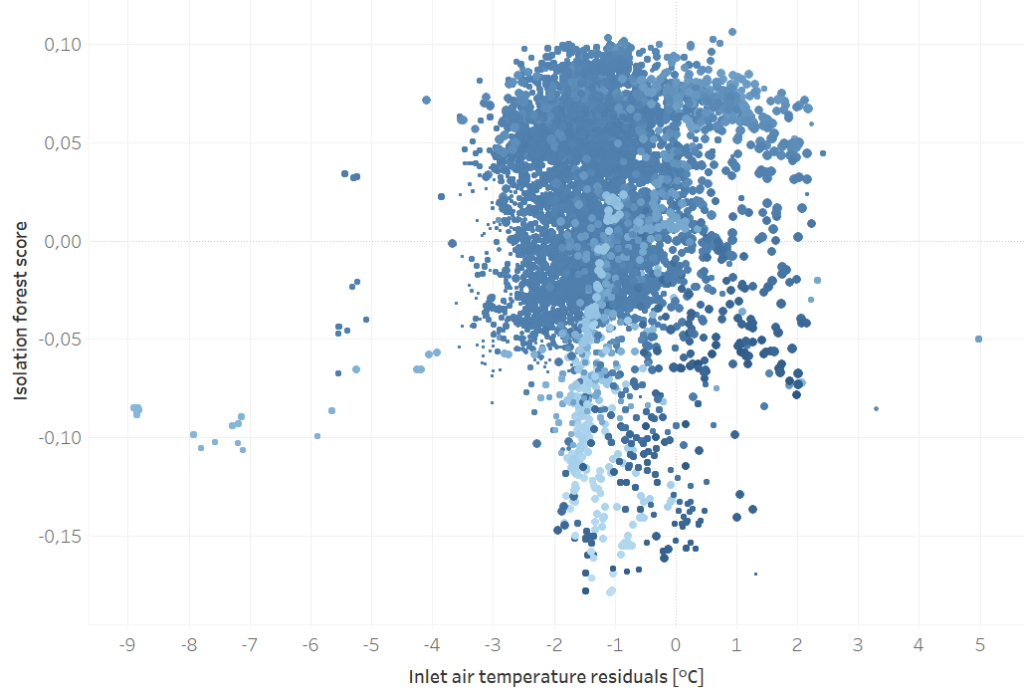
One of the major challenges was determining whether a model was extrapolating beyond known data—meaning it was making predictions in conditions it had never seen before. To address this, we incorporated Isolation Forest, an anomaly detection algorithm designed to identify novel or out-of-distribution data points.
In summary, for each measured variable, our system automatically deployed:
- A dedicated ML model trained to predict that specific variable using the most relevant inputs and an optimized model structure.
- An Isolation Forest model to assess whether the prediction was made within known data conditions or if the model was extrapolating into unfamiliar territory.

Lesson learned
First off, building a fully automated fault detection system at this scale is no small feat. Just running all the models took several hours of computation, with feature selection being the biggest bottleneck. And then there’s the reality of working with real-world data—it always comes with surprises. Thanks to Energy Twin’s built-in preprocessing features, such as outlier removal and automated data cleaning, we were able to handle many of these challenges efficiently. But even with these tools, the sheer scale of the problem meant that small data issues could still snowball across all of the models and variables.
But the biggest challenge? Drawing a clear line between normal and abnormal behavior. Isolation Forest helped filter out a lot of false alarms, but the distinction was still fuzzy. The key issue was setting a reliable threshold for the residual signal—how much deviation is “too much”? The only real way to do this was to review all the residual signals and manually fine-tune the threshold for every single model and variable. What was meant to be a fully automated solution instead requires extensive manual configuration—an approach that is neither scalable nor efficient.
Conclusion
Even though the results weren’t as convincing as we had hoped, we still love the core idea—a fully automated process that detects “suspicious” values using multiple smaller ML models. The concept is powerful, but in practice, it requires too much fine-tuning to be truly hands-off.
For now, we’re taking a more practical approach—fewer handpicked target variables and a bit more human touch in defining the ML structure, especially in feature selection. While we’ve adjusted our approach for now, the goal of full automation isn’t forgotten—we’re excited to revisit it as technology evolves.
What do you think? Is this kind of automation the future, or will human expertise always play a role?


Companies often understand the importance of deploying smart meters and getting data online. They see it as a key milestone—and while it is, it’s only the beginning of the journey. As mathematicians say, this is a “necessary condition” but not a “sufficient condition.” Without proper utilization, the full potential of your smart metering investment remains untapped. Let’s explore some common misconceptions and mistakes made in this space.
Mistake #1: Focusing on Visual Style and “Gadgets”
Making energy data accessible on a tablet, phone, or PC is useful—but that alone doesn’t mean you’re leveraging it effectively. Too often, decision-makers focus on the appearance of dashboards and the appeal of new gadgets, prioritizing style over substance. While good design can enhance usability, it’s one of the least important factors in an effective energy management system. The real value isn’t in how the data looks, but in how it’s processed and analyzed to extract actionable insights that drive real impact.
Mistake #2: Lack of Computational Capabilities
Many energy software tools offer basic charting features, allowing users to compare energy consumption across time periods, like months or years. Some even incorporate weather normalization through degree days. While these functions are useful, they fall short when dealing with smart meter data, which often comes in 15-minute intervals. This level of granularity introduces a new challenge—one that requires more advanced computational methods than simple charts or weather adjustments can offer.
Most software platforms aren’t built to harness the full power of these high-frequency data streams. Advanced machine learning (ML) algorithms can uncover hidden patterns, enabling businesses to improve efficiency and optimize performance. Without these computational tools, companies miss out on valuable insights, ultimately leaving much of their smart metering investment underutilized.
Mistake #3: Expecting One Tool to Solve Everything
In many Requests for Proposals (RFPs), companies look for an all-in-one solution—software that can handle everything from data collection and compliance reporting to invoicing, tariff calculations, forecasting, and AI-driven analytics. Ideally, they want a system that does it all with a single click while adhering to local regulations.
However, expecting one tool to excel in all these areas is unrealistic, especially given the diverse and region-specific requirements in the energy sector. Instead, companies should prioritize creating an independent data layer—a centralized repository where energy data is accessible via APIs. This approach allows for modularity, enabling you to integrate and replace specialized tools as needed without vendor lock-in. With this setup, each component of the ecosystem performs at its best while remaining seamlessly connected to the larger system.
Conclusion
Building an effective energy management system isn’t just about installing smart meters or selecting a single software solution—it’s about creating a foundation that is both flexible and future-proof. The key lies in establishing an independent data layer, a centralized hub where energy data remains accessible via APIs. This ensures seamless integration across different tools and systems, giving businesses the freedom to adapt and experiment without being tied to a single vendor.
By adopting this modular strategy, you can harness the full potential of your energy data. Advanced AI-driven tools can uncover hidden insights, optimize operations, and identify opportunities that might otherwise go unnoticed. At the same time, maintaining an independent data infrastructure allows for smooth integration of key processes like regulatory compliance, ESG reporting, and tariff calculations, all without the constraints of an all-in-one platform.
In the rapidly evolving energy landscape, flexibility is essential. By building an energy management ecosystem that encourages experimentation and innovation, you position yourself to continually improve and adapt. The journey doesn’t end with data collection—it begins there. A well-structured, independent data layer ensures that the insights gained today will continue to drive smarter decisions for years to come.


